Slick Pick For Watford Nick
McLaren Living has been picked for its slickness of delivery for the redevelopment of Watford Police Station and Magistrates Court and to deliver 314...
Read Full Article
A new EG Propertylink study has shown the UK local authorities with the largest increase in new homes built over a ten-year period which drew on figures from the Office for National Statistics.
It is based on permanent dwellings started and completed by local authorities between 2014 and 2023. The average number of new dwellings started and built in the period was then scaled against the total population and ranked according to homes built per 10,000 residents.
The region that saw the most buildings started and built was South Derbyshire, which on average had 160.4 new dwellings per 10,000 residents – a rate 176% above the national average (58.1 per 10,000 people). Between 2014 and 2023, the ONS data reports there were an average of 1,782 starts and completions of dwellings per 10,000, making it the highest in the country. In 2014 there were 970 starts and completions in total, rising 79% to 1,740 in 2023.
Stratford-upon-Avon
Next in line is the home of Shakespeare Stratford-upon-Avon with an average of 151.5 projects per 10,000 residents. The area, located in Warwickshire, saw 1,820 starts and completions in 2023 alone, though its average across the decade stands at 2,099. Compared to 2014, the 2023 rate is 72% higher.
Midlothian
In third place is Midlothian in Scotland with a rate of 151.4 permanent dwellings per 10,000 residents. Midlothian has the highest rate of new dwellings per 10,000 residents in Scotland, with an average of 1,469 started and completed on average each year since 2014. With its proximity to Edinburgh, the place has proven very popular.
Tewkesbury
Ranking in fourth place is Tewkesbury in Gloucestershire, with a rate of 141.4 new dwellings per 10,000 residents. Last year, there were 1,640 new homes started or completed, an increase of 74% compared to 2014’s 940 dwellings.
Oxfordshire
Vale of White Horse in Oxfordshire comes next, with 134.2 new dwellings per 10,000 residents. In 2023, there were 1,670 new dwellings built or started, an increase of 35% compared to 2014’s 1,240 but a decrease of 27% compared to 2022 (2,290).
Leicestershire
In sixth place, Harborough in Leicestershire saw an average of 132.7 new dwellings per 10,000 residents between 2014 and 2023. While the number of annual starts and completions has remained relatively steady over the past decade, with 1,110 new dwellings were recorded in 2023, Harborough has seen a modest 5% increase compared to 2014.
North-West Leicestershire follows in seventh place, averaging 129 new dwellings per 10,000 residents. However, unlike many other areas, the region saw a slight decline over the past decade, with 1,390 new starts and completions recorded in 2023 – 14% fewer than the 1,620 reported in 2014.
Ribble Valley
Eighth on the list is Ribble Valley in Lancashire, where there were 126.3 new dwellings per 10,000 residents on average across the decade. While the area didn’t experience significant growth, it maintained a steady level of development, with 640 new homes in 2014 and 650 in 2023, reflecting a slight increase of 2%.
Dartford
Dartford in Kent ranks ninth, with an average of 124.4 new dwellings per 10,000 people. Although the area experienced a surge in building in the mid-decade (peaking at 1,950 dwellings in 2016), the trend slowed in recent years, with 1,150 new homes completed in 2023 – 14% less than in 2014 (1,330).
East Lothian
Rounding out the top ten is East Lothian in Scotland, which recorded an average of 122.7 new dwellings per 10,000 residents. The region experienced one of the highest growth rates between 2014 and 2023, with new starts and completions jumping by 251%. In 2023, East Lothian saw 1,720 new homes – a significant increase from the 490 recorded in 2014, highlighting its growing popularity as a residential area near Edinburgh.
Bottom of the list
On the opposite end of the study, Richmond upon Thames in Greater London saw the lowest number of dwellings built per 10,000 residents at just 11.5 - an 80% decrease from the national average. Last year, there were just 110 starts and completions in the area, with the region having its peak of new dwellings in 2015 when 420 were started or completed.
Pressure points
Chloe Ward, the product manager at EG Propertylink says: “These numbers really spotlight the contrast in housing growth across the UK, as well as naming potential up-and-coming regions. Regions like South Derbyshire and Stratford-upon-Avon are seeing remarkable rates of development, driven by demand for suburban and semi-rural living. In contrast, places like Richmond upon Thames show the pressures urban areas face with limited space and complex planning regulations, which restrict new builds.”
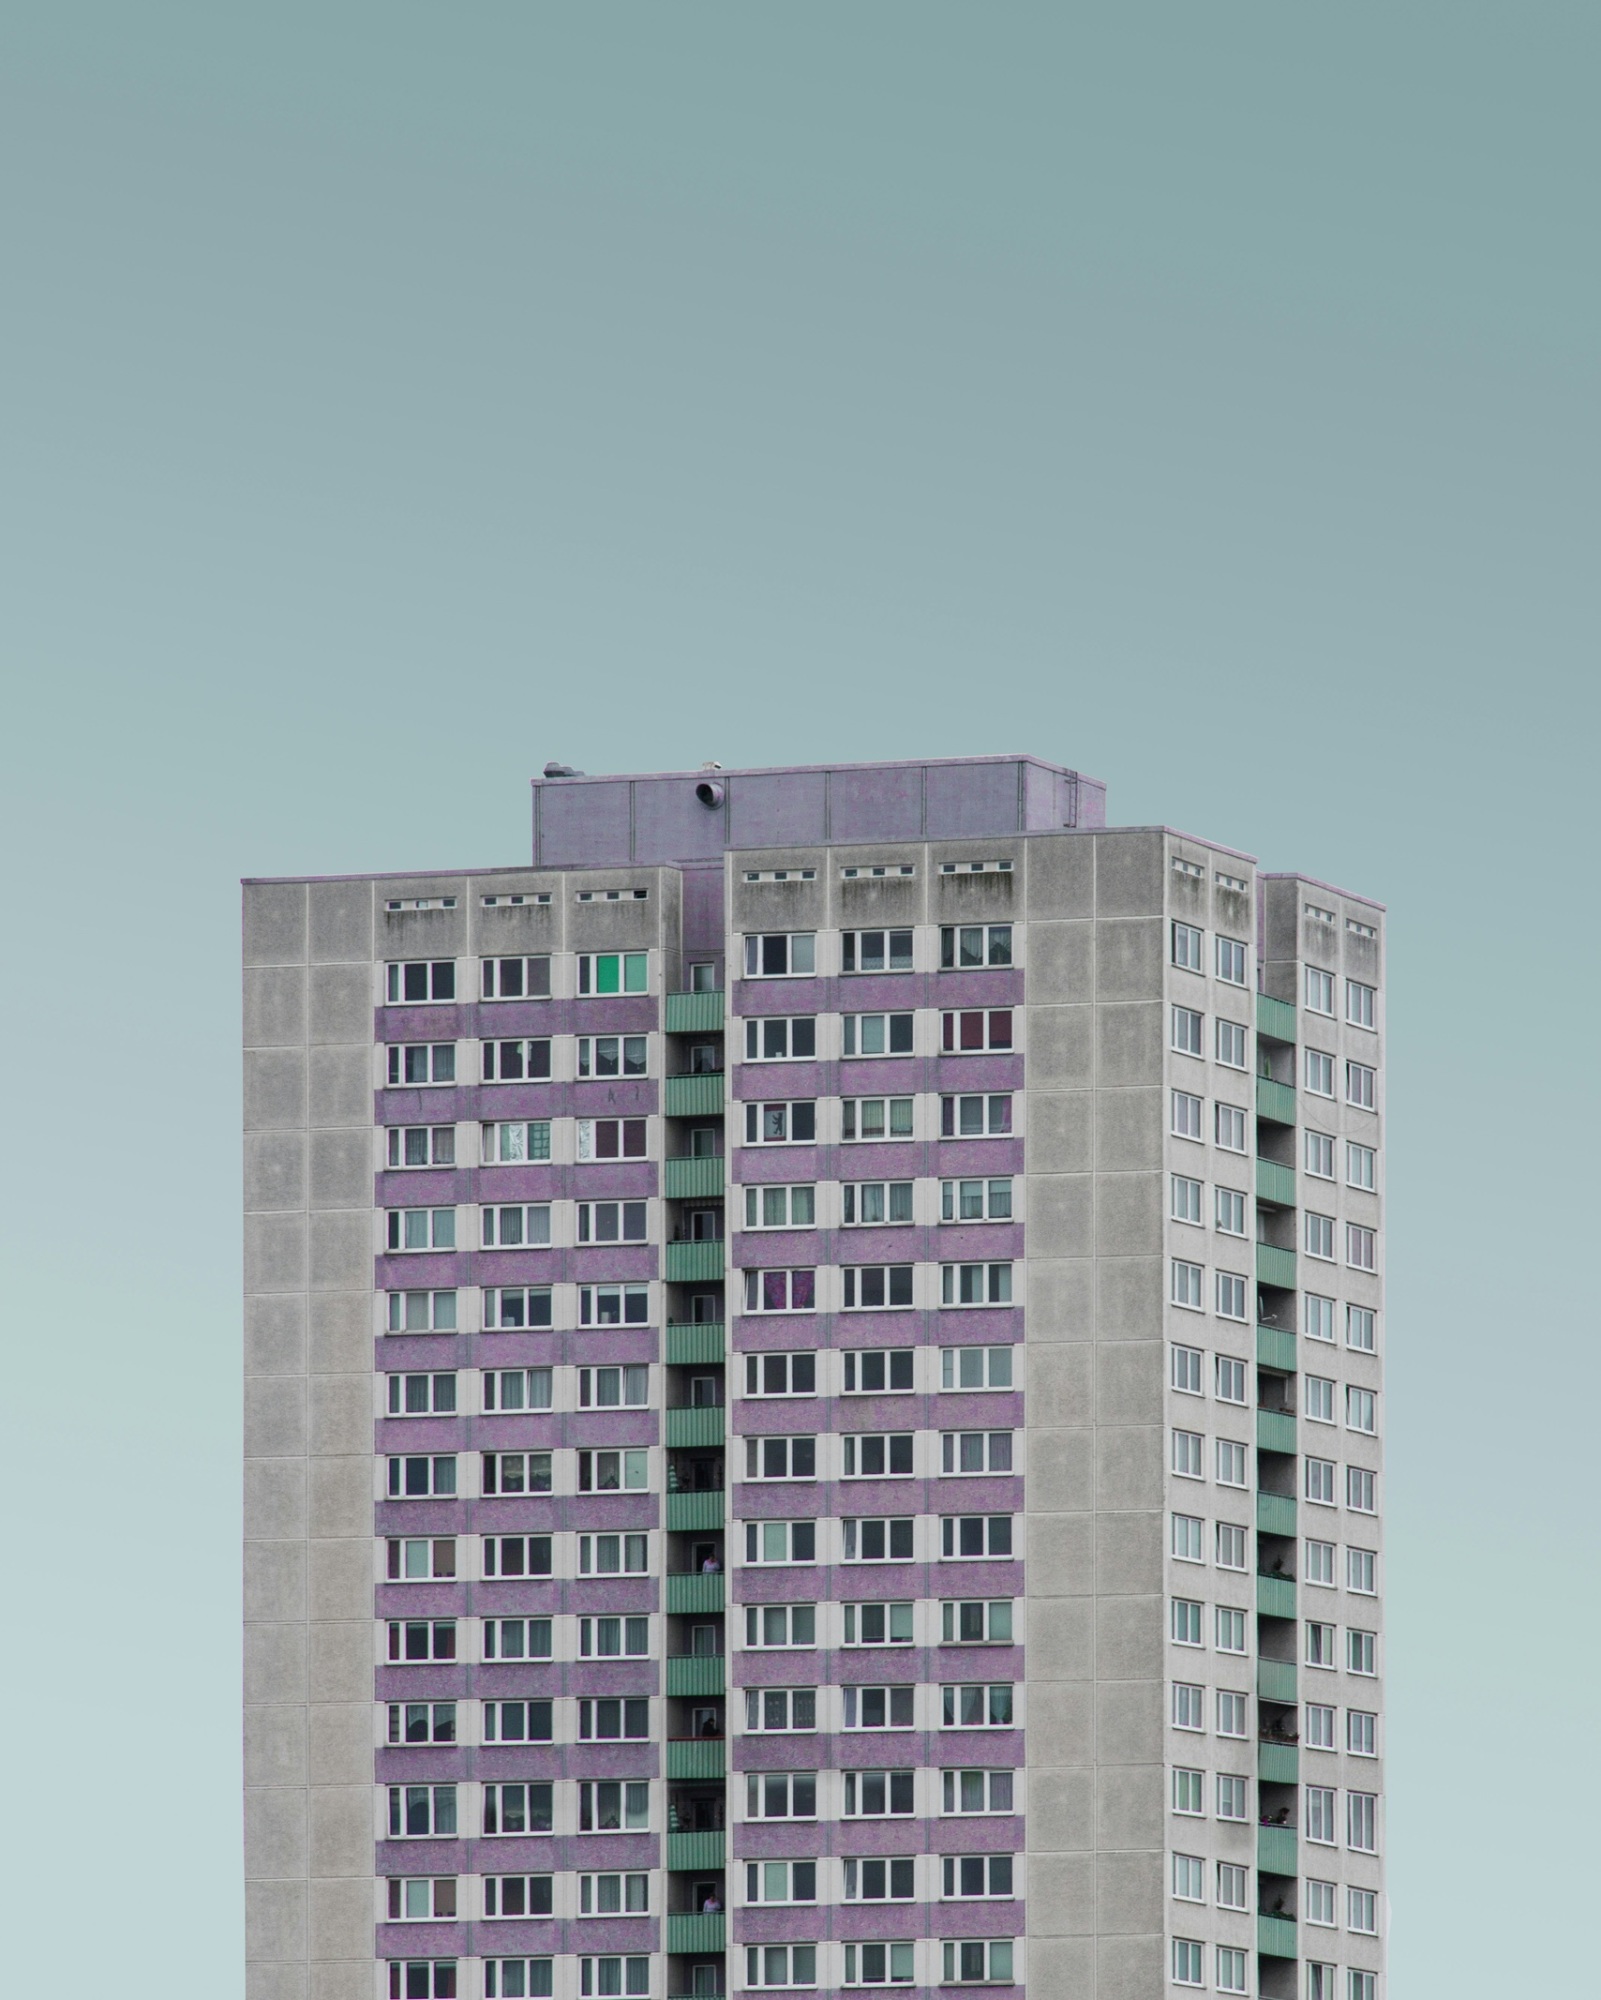
Picture: The Office for National Statistics has highlighted the regions where most homes are consistently being built – and where they are not.
www.propertylink.estatesgazette.com
Article written by Cathryn Ellis
12th March 2025